Buick U.S Car Sales Data
This is your hub for all of the Buick sales data for the U.S market.
Part of the General Motors stable, Buick is the oldest active American automobile brand and was the company that established General Motors in 1908.
Buick is largely marketed as an affordable luxury brand that sits above Chevrolet and just below Cadillac. Gone are the days of boring and poorly made Buick’s. The recent cars have been stellar, high quality, high luxury cars that even seasoned car guys like us have been impressed with.
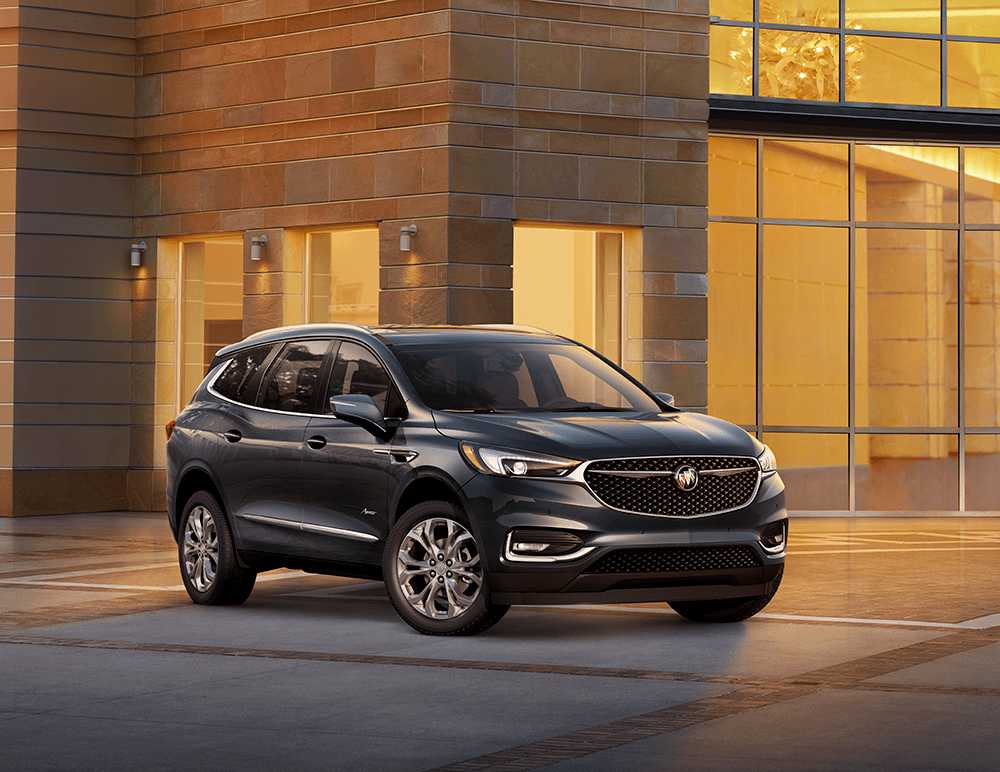
Buick makes its cars in the U.S (with the exception of the Encore which is imported). The current product range is robust and growing. Buick has the Buick Envision which is a compact luxury SUV, the Buick Enclave which is their mid-size luxury SUV and the Buick Enclave Avenir mid-size luxury SUV. On the passenger car side, Buick has the Regal luxury wagon, the Buick Regal Sportback luxury sedan, the Regal GS luxury sedan and the Buick LaCrosse which is its full-size luxury sedan.
Our Take On Buick US Sales Figures
US Sales of Buick cars have been a bit of a roller coaster ride in the last twenty years. Sales declined precipitously in the 2000s as the brand offered poorly designed and made cars that were just plain bad. 2002 sales were 432k units, with sales dropping to 337k units in 2003 and then continuing to decline until 2009 when US sales bottomed out at 102,306. Talk about a brand losing relevance in its home market.
Since then things have picked up and growth has been steady and strong as Buick cars have improved. In 2010 sales jumped from the 102k units in 2009 to 155k units. While some of that was an improving economy in the US, the trend continued in 2011 with 177k units sold and then a steady growth to 180k, 205k, 228k for 2012, 2013 and 2014. More recently it seems that sales are once again stagnant so we will see how things continue in coming years.
Buick Monthly Sales Data
Below we have a table that shows Buick sales for the United States automotive market since 2004, but this time it is broken out by month. This is on a unit basis. This is Buick new vehicle sales in the US.
Buick Sales & Growth
Below is the unit volume sales and unit growth rate for the Buick brand in the United States
Buick Annual Sales and Market Share
| Year | Sales | YOY Change | US Marketshare | Marketshare Change |
|---|---|---|---|---|
| 2005 | 282,288 | 0.00 | 1.67 | 0.00 |
| 2006 | 240,657 | -14.75 | 1.46 | -14.16 |
| 2007 | 186,091 | -22.67 | 1.16 | -26.00 |
| 2008 | 137,197 | -26.27 | 1.05 | -11.11 |
| 2009 | 102,306 | -25.43 | 0.99 | -5.82 |
| 2010 | 155,389 | 51.89 | 1.35 | 26.76 |
| 2011 | 177,629 | 14.31 | 1.40 | 3.51 |
| 2012 | 194,431 | 9.46 | 1.26 | -10.65 |
| 2013 | 205,509 | 5.70 | 1.33 | 4.69 |
| 2014 | 228,963 | 11.41 | 1.39 | 4.83 |
| 2015 | 222,785 | -2.70 | 1.28 | -8.91 |
| 2016 | 229,631 | 3.07 | 1.31 | 2.45 |
| 2017 | 219,231 | -4.53 | 1.27 | -3.02 |
| 2018 | 207,223 | -5.48 | 1.20 | -6.48 |
| 2019 | 206,926 | -0.14 | 1.22 | 1.59 |
| 2020 | 162,749 | -21.35 | 1.11 | -9.77 |
| 2021 | 182,380 | 12.06 | 1.22 | 9.20 |
| 2022 | 19,145 | 0.00 | 0.41 | 0.00 |


