Infiniti U.S Car Sales Data
This is your hub for all of the Infiniti sales data for the U.S market.
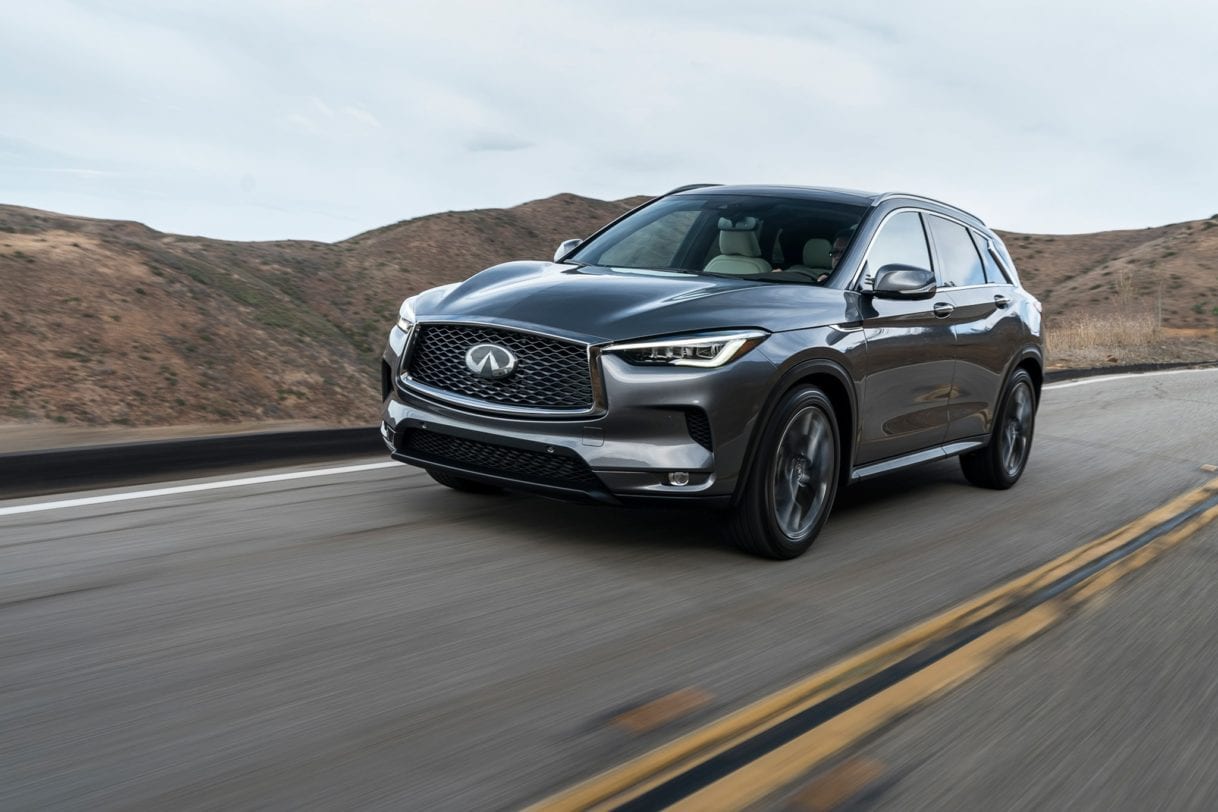
Infiniti is the luxury brand of Japanese automaker, Nissan. The brand was first launched by Nissan in North America in 1989. The brand is focused in producing luxury vehicles for the North American market.
The start of Infiniti in North America, particularly in the US, is slow. Its sales is lagging behind the Acura (Honda’s luxury brand) and Lexus (Toyota’s luxury brand). It was only in 2000s that Infiniti started to gain ground against other luxury brands in the US when they introduced the Infiniti G35, a mid-size sedan.
Today, Infiniti’s lineup includes the Q50, Q60, QX50, QX60, and QX80. Their current models ranges from luxury coupes to SUVs. Regardless of the model, you will always find that all of Infiniti’s vehicles are focused on luxury, sport, quality and value.
Our Take On Infiniti US Sales Figures
Sales of Infiniti in US has been hugely positive over the last few years. In fact in 2017, the brand has a record year after selling 153,415 in the US. Even though Infiniti markets their cars worldwide, the United States is still their biggest market.
Infiniti has also announced recently that they would be shifting to electric vehicles. They claimed that all their new cars will be a hybrid or an electric vehicle by 2021. This should help increase the brand’s sales figures in the US since more and more American people are interested in electric vehicles.
Infiniti Monthly Sales Data
Below we have a table that shows Infiniti sales for the United States automotive market, but this time it is broken out by month. This is on a unit basis. This is Infiniti new vehicle sales in the US.
Infiniti Sales & Growth
Below is the unit volume sales and unit growth rate for the Infiniti brand in the United States.
Infiniti Annual Sales and Market Share
Below we have a table that shows Infiniti sales volumes for the US automotive market. This data captures all Infiniti car sales. We found a great data source in Infiniti directly who publishes sales data for the U.S market periodically. We were able to aggregate the data into the below format.
| Year | Sales | YOY Change | US Marketshare | Marketshare Change |
|---|---|---|---|---|
| 2005 | 138,401 | 0.00 | 0.82 | 0.00 |
| 2006 | 121,146 | -12.47 | 0.74 | -11.19 |
| 2007 | 127,035 | 4.86 | 0.79 | 7.09 |
| 2008 | 113,090 | -10.98 | 0.86 | 7.98 |
| 2009 | 81,089 | -28.30 | 0.78 | -10.05 |
| 2010 | 103,411 | 27.53 | 0.90 | 12.77 |
| 2011 | 98,460 | -4.79 | 0.78 | -15.84 |
| 2012 | 129,116 | 31.14 | 0.84 | 7.64 |
| 2013 | 116,455 | -9.81 | 0.75 | -11.69 |
| 2014 | 117,330 | 0.75 | 0.71 | -5.24 |
| 2015 | 133,498 | 13.78 | 0.77 | 6.86 |
| 2016 | 137,970 | 3.35 | 0.79 | 2.71 |
| 2017 | 153,415 | 11.19 | 0.89 | 11.55 |
| 2018 | 149,280 | -2.70 | 0.86 | -3.43 |
| 2019 | 117,708 | -21.15 | 0.69 | -24.63 |
| 2020 | 79,503 | -32.46 | 0.54 | -27.83 |
| 2021 | 58,555 | -26.35 | 0.39 | -38.15 |
| 2022 | 11,246 | 0.00 | 0.24 | 0.00 |
Infiniti Model Specific Sales Reports
EX, FX, G/Q40, JX, M, Q50, Q60, Q70, QX30, QX50, QX56, QX60, QX70, QX80