Jaguar U.S Car Sales Data
This is your hub for all of the Jaguar sales data for the U.S market.
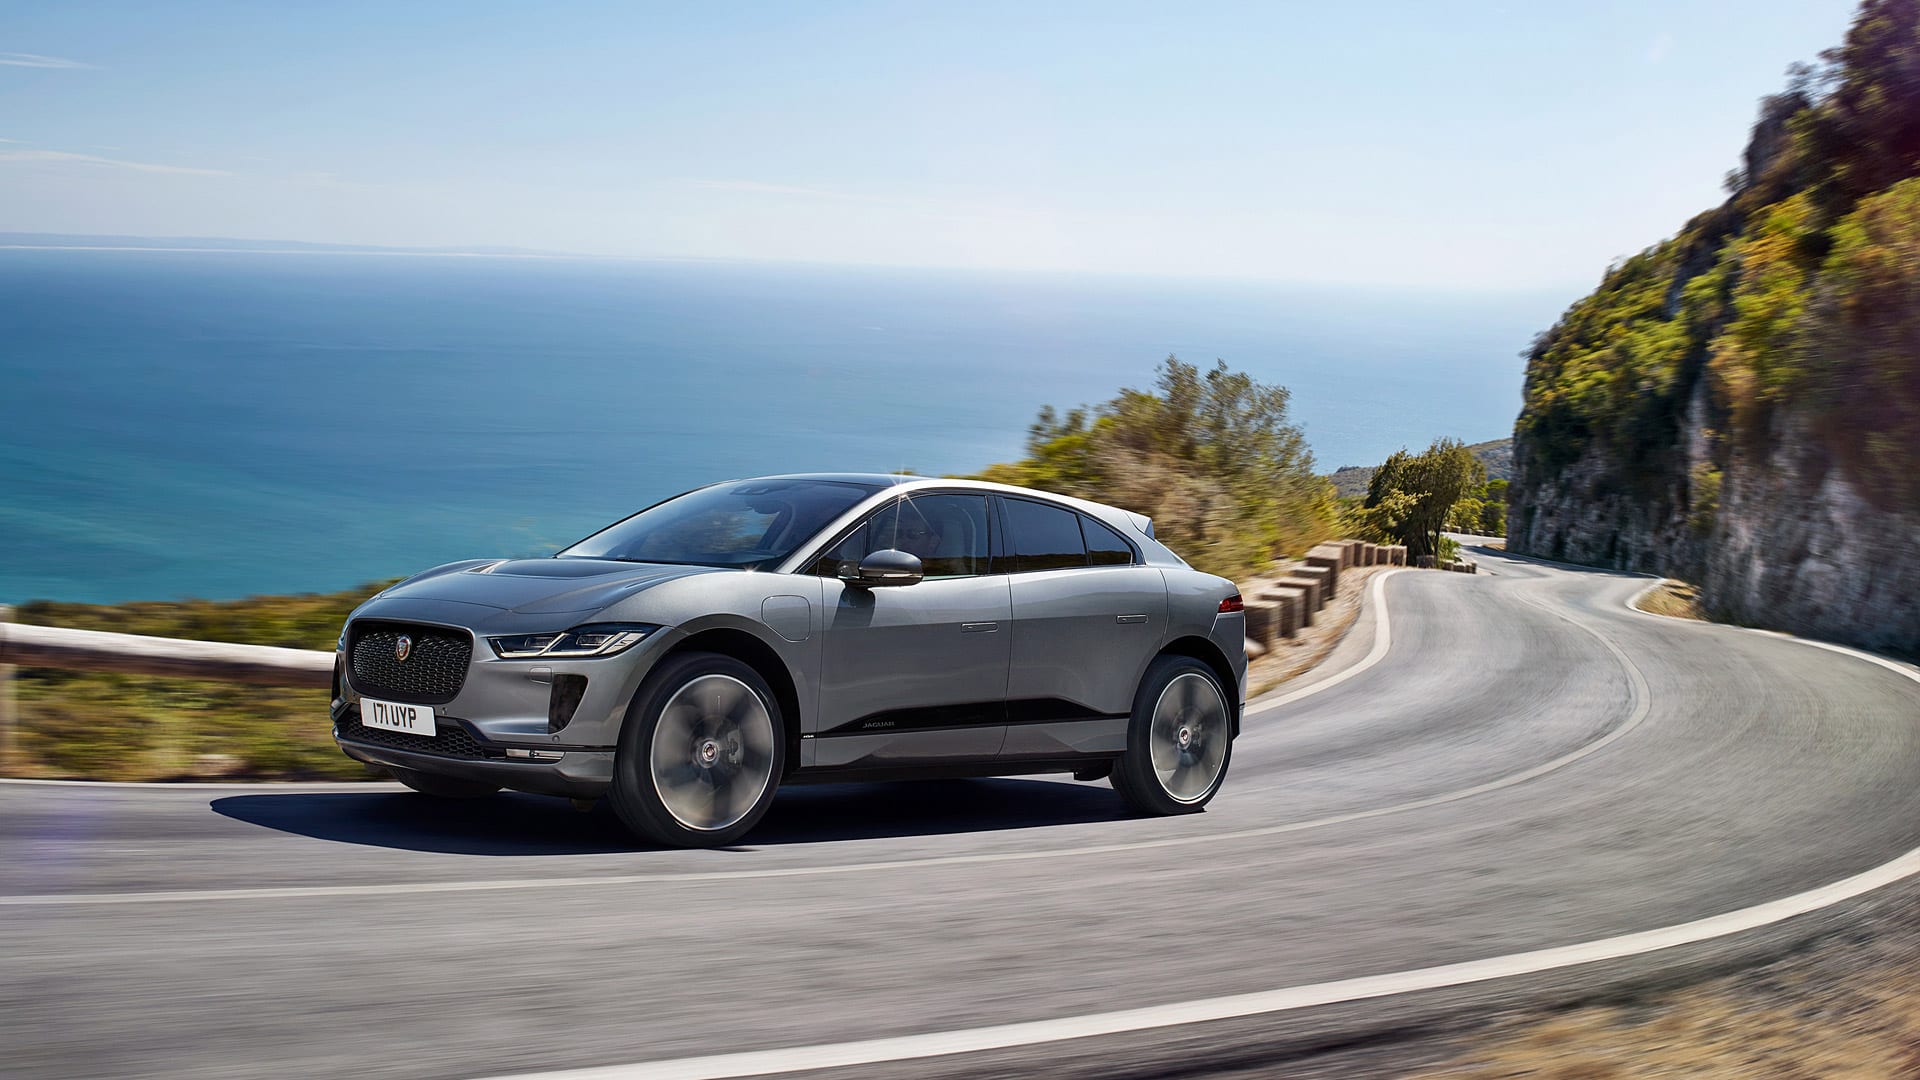
Jaguar is a British luxury vehicle brand currently owned by Jaguar Land Rover. The brand is known for its luxury sedans, SUVs, and sports cars such as the Jaguar XF, Jaguar I-Pace, and Jaguar F-Type.
The company has been making luxurious sedans and highly competitive sports cars for decades. But just recently, the brand has also expanded their product offerings. They’ve added a crossover and a SUV to their portfolio which continues to perpetuate the brand’s main attributes fast speed, powerful acceleration, responsive handling, and incredible aesthetics.
Whether it’s a sedan, a crossover, or SUV, a Jaguar is a blast to drive. Even their entry-level luxury models such as , the XE and the subcompact E-Pace, are a joy to drive. The XE caters to mainstream customers which will allow them to join in the company’s exclusive club.
Our Take On Jaguar US Sales Figures
In 2016, Jaguar has been reported as being the hottest brand in the the United States. This is due to the surge of their sales which rose from 14,496 in 2015 to 31,243 by next year. By 2017, the brand followed up their success from 2016 and hit their highest reported sales in a calendar year, 39,886 vehicles.
The year 2017 was the most successful year for Jaguar so far in the US. Their newly introduced electric SUVs such as the Jaguar E-Pace, Jaguar F-Pace, and Jaguar I-Pace are incredibly popular in the country. Even though sales of Jaguar-branded vehicles in 2018 and 2019 were down as compared to 2017, we expect the British luxury marquee to find more success in the US market as more and more customers are switching to electric vehicles.
Jaguar Monthly Sales Data
Below we have a table that shows Jaguar sales for the United States automotive market, but this time it is broken out by month. This is on a unit basis. This is Jaguar new vehicle sales in the US.
Jaguar Sales & Growth
Below is the unit volume sales and unit growth rate for the Jaguar brand in the United States.
Jaguar Annual Sales and Market Share
| Year | Sales | YOY Change | US Marketshare | Marketshare Change |
|---|---|---|---|---|
| 2005 | 30,424 | 0.00 | 0.18 | 0.00 |
| 2006 | 20,683 | -32.02 | 0.13 | -43.17 |
| 2007 | 15,683 | -24.17 | 0.10 | -28.49 |
| 2008 | 10,625 | -32.25 | 0.08 | -20.92 |
| 2009 | 10,380 | -2.31 | 0.10 | 19.23 |
| 2010 | 13,340 | 28.52 | 0.12 | 13.45 |
| 2011 | 12,695 | -4.84 | 0.10 | -15.90 |
| 2012 | 13,033 | 2.66 | 0.08 | -17.97 |
| 2013 | 16,952 | 30.07 | 0.11 | 22.55 |
| 2014 | 15,773 | -6.95 | 0.10 | -13.95 |
| 2015 | 14,496 | -8.10 | 0.08 | -15.31 |
| 2016 | 31,243 | 115.53 | 0.18 | 53.35 |
| 2017 | 39,886 | 27.66 | 0.23 | 22.96 |
| 2018 | 30,254 | -24.15 | 0.17 | -32.69 |
| 2019 | 31,005 | 2.48 | 0.18 | 4.11 |
| 2020 | 21,786 | -29.73 | 0.15 | -22.87 |
| 2021 | 17,149 | -21.28 | 0.11 | -29.26 |
| 2022 | 2,816 | 0.00 | 0.06 | 0.00 |