Land Rover U.S Car Sales Data
This is your hub for all of the Land Rover sales data for the U.S market.
Land Rover is a British brand of four-wheel drive cars, that exclusively offers premium and luxury sport utility vehicles.The Land Rover is focused on utility, practicality, and off-road prowess. Land Rover currently sells two sport utility vehicles: the Discovery Sport and the Discovery.
Land Rover was originally owned by a now-defunct British automaker called Rover Company. The first Land Rover debuted in 1948 as a tough vehicle, modeled after the Jeeps used in World War II. The vehicle was so popular it evolved into the Land Rover company. In 1970, Land Rover launched the Range Rover SUV, a utilitarian, body-on-frame truck with outstanding off-road capability, in 1970. The company was briefly owned by BMW in the 1990s and Ford in the 2000s. The company has been owned by Tata Motors since 2008.
Land Rover vehicles boast luxury features and high-end cabins full of utility and comfort. The trucks’ sleek, muscular stance suggests that it can tackle tough terrain or power effortlessly down the highway. Land Rover’s vehicles are particularly suited to adventure-seeking buyers and off-road driving.
Our Take On Land Rover US Sales Figures
Sales of Land Rover in US has increased every year for the last 10 years. Their sales peaked in 2019 after selling 94,736. We expect them to continue their success in the US as the market for crossovers and SUVs continues to increase every year.
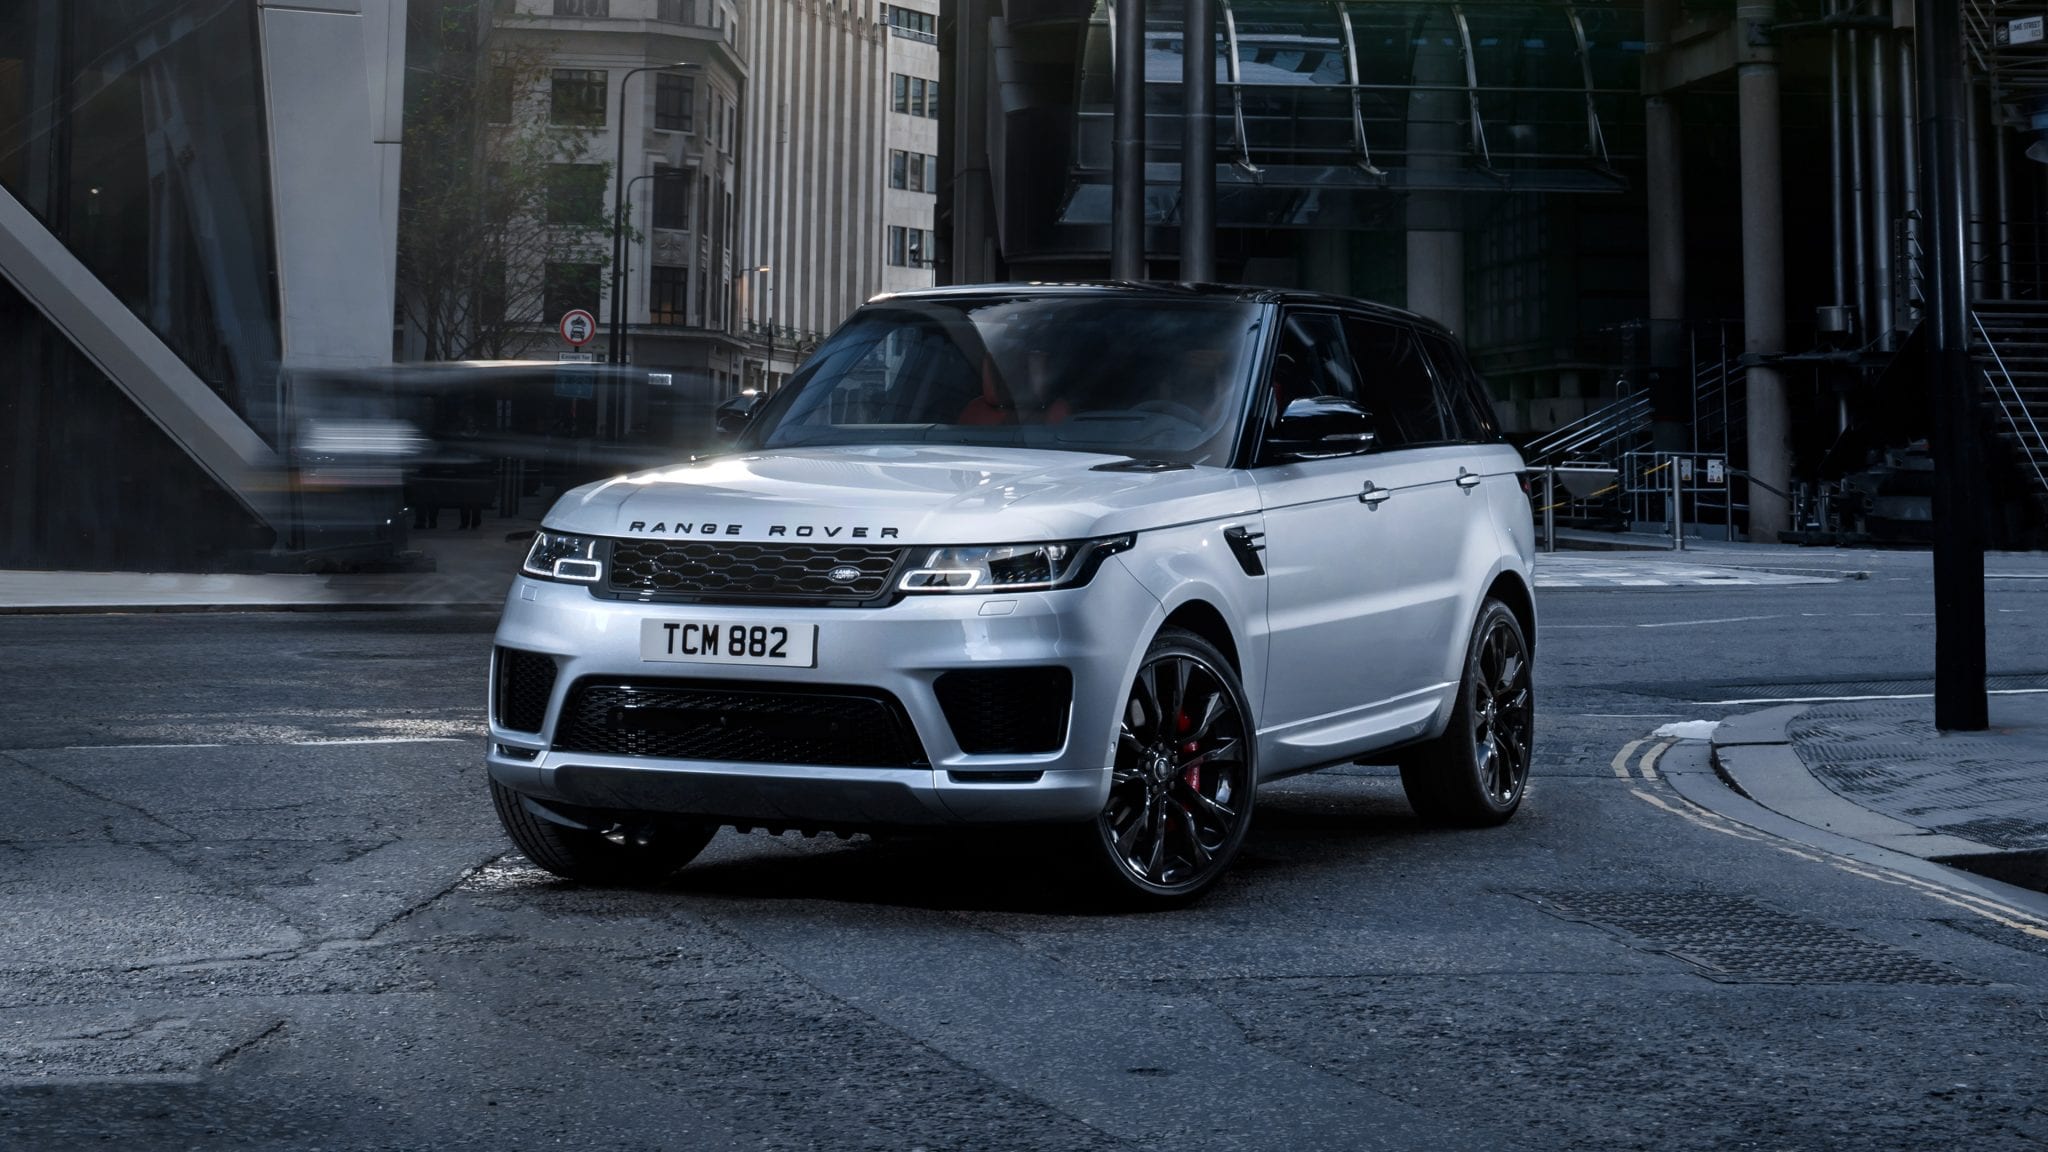
Currently Land Rover imports all of its models for the US market from its factories in Halewood and Solihull, UK. The Range Rover Sport large SUV has been Land Rover’s best selling model in the United States since 2006 and even reached record sales in 2019.
Land Rover Monthly Sales Data
Below we have a table that shows Land Rover sales for the United States automotive market, but this time it is broken out by month. This is on a unit basis. This is Land Rover new vehicle sales in the US.
Land Rover Sales & Growth
Below is the unit volume sales and unit growth rate for the Land Rover brand in the United States.
Land Rover Annual Sales and Market Share
Below we have a table that shows Land Rover sales volumes for the US automotive market. This data captures all Land Rover car sales. We found a great data source in Land Rover directly who publishes sales data for the U.S market periodically. We were able to aggregate the data into the below format.
| Year | Sales | YOY Change | US Marketshare | Marketshare Change |
|---|---|---|---|---|
| 2005 | 46,175 | 0.00 | 0.27 | 0.00 |
| 2006 | 47,774 | 3.46 | 0.29 | 5.93 |
| 2007 | 49,550 | 3.72 | 0.31 | 6.06 |
| 2008 | 21,156 | -57.30 | 0.16 | -91.87 |
| 2009 | 22,707 | 7.33 | 0.22 | 26.48 |
| 2010 | 31,873 | 40.37 | 0.28 | 20.75 |
| 2011 | 37,486 | 17.61 | 0.30 | 6.22 |
| 2012 | 46,819 | 24.90 | 0.30 | 3.03 |
| 2013 | 50,010 | 6.82 | 0.32 | 5.69 |
| 2014 | 51,465 | 2.91 | 0.31 | -3.03 |
| 2015 | 70,582 | 37.15 | 0.41 | 22.73 |
| 2016 | 73,861 | 4.65 | 0.42 | 3.91 |
| 2017 | 74,326 | 0.63 | 0.43 | 2.26 |
| 2018 | 92,143 | 23.97 | 0.53 | 18.81 |
| 2019 | 94,736 | 2.81 | 0.56 | 4.42 |
| 2020 | 80,033 | -15.52 | 0.54 | -2.20 |
| 2021 | 89,778 | 12.18 | 0.60 | 9.30 |
| 2022 | 17,400 | 0.00 | 0.37 | 0.00 |
Land Rover Model Specific Sales Reports
Discovery, Discovery Sport, LR2, LR4, Range Rover, Range Rover Evoque, Range Rover Sport, Range Rover Velar