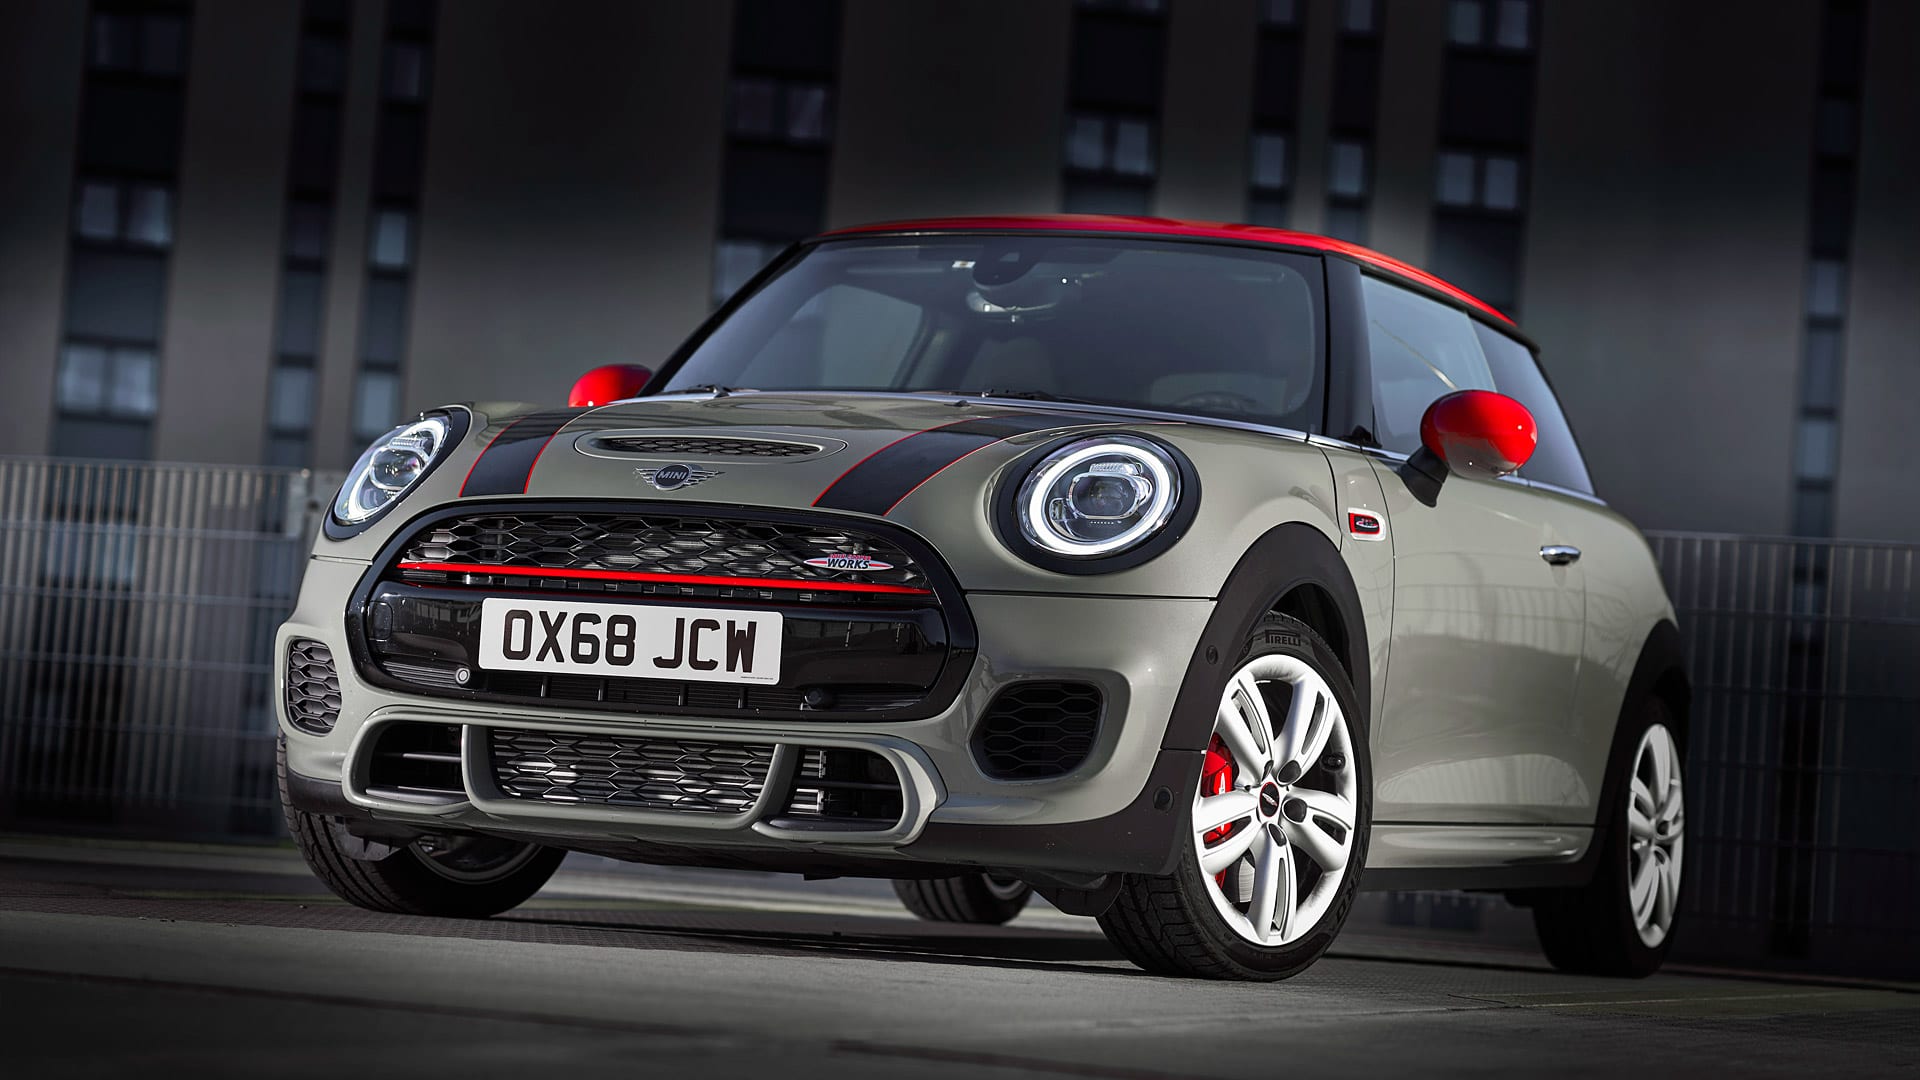
Mini U.S Car Sales Data
This is your hub for all of the Mini sales data for the U.S market.
Mini is a British automotive marquee known for its small cars. The Mini brand was first launched in 1969 by a now-defunct car manufacturer, the British Motor Corporation. The brand was then acquired by Rover Group in 1986. Today, the Mini brand is owned by the German automotive company, BMW, which markets it worldwide.
After selling over 5.3 million vehicles, Mini is the most popular British car of all time. The Mini brand has gone on to charm the world which caused it spawn a host of derivatives. It even became a star in films and a fashion icon at the height of its popularity.
Today, Mini is still very popular around the world. In fact, thousands of these are still found on the road. The pre-1980 versions of Mini are now even considered as a collector’s item.
Our Take On Mini US Sales Figures
Even though Mini is sold worldwide, the United States is considered to be its largest market, which accounted for more than 25% of its global sales in 2012. For years, Mini has been selling its car quite well in the US which hovers around 40k and 65k since 2007.
Things changed drastically in 2019 though, as Mini sales in the US dropped to just 36,165 which is its lowest since 2002. This is probably because the demand for small cars in the US has dropped while the SUV market continues to rise.
Mini Monthly Sales Data
Below we have a table that shows Mini sales for the United States automotive market, but this time it is broken out by month. This is on a unit basis. This is Mini new vehicle sales in the US.
Mini Sales & Growth
Below is the unit volume sales and unit growth rate for the Mini brand in the United States.
Mini Annual Sales and Market Share
Below we have a table that shows Mini sales volumes for the US automotive market. This data captures all Mini car sales. We found a great data source in Mini directly who publishes sales data for the U.S market periodically. We were able to aggregate the data into the below format.
| Year | Sales | YOY Change | US Marketshare | Marketshare Change |
|---|---|---|---|---|
| 2005 | 40,820 | 0.00 | 0.24 | 0.00 |
| 2006 | 39,171 | -4.04 | 0.24 | -1.42 |
| 2007 | 42,011 | 7.25 | 0.26 | 9.16 |
| 2008 | 54,077 | 28.72 | 0.41 | 36.36 |
| 2009 | 45,225 | -16.37 | 0.44 | 5.65 |
| 2010 | 45,644 | 0.93 | 0.40 | -10.22 |
| 2011 | 50,051 | 9.66 | 0.39 | -0.59 |
| 2012 | 71,103 | 42.06 | 0.46 | 14.75 |
| 2013 | 66,502 | -6.47 | 0.43 | -7.71 |
| 2014 | 56,112 | -15.62 | 0.34 | -25.66 |
| 2015 | 58,514 | 4.28 | 0.34 | -1.62 |
| 2016 | 52,030 | -11.08 | 0.30 | -13.08 |
| 2017 | 47,102 | -9.47 | 0.27 | -8.64 |
| 2018 | 43,684 | -7.26 | 0.25 | -8.52 |
| 2019 | 36,165 | -17.21 | 0.21 | -18.70 |
| 2020 | 28,047 | -22.45 | 0.19 | -11.33 |
| 2021 | 35,168 | 25.39 | 0.24 | 18.85 |
| 2022 | 6,875 | 0.00 | 0.15 | 0.00 |


