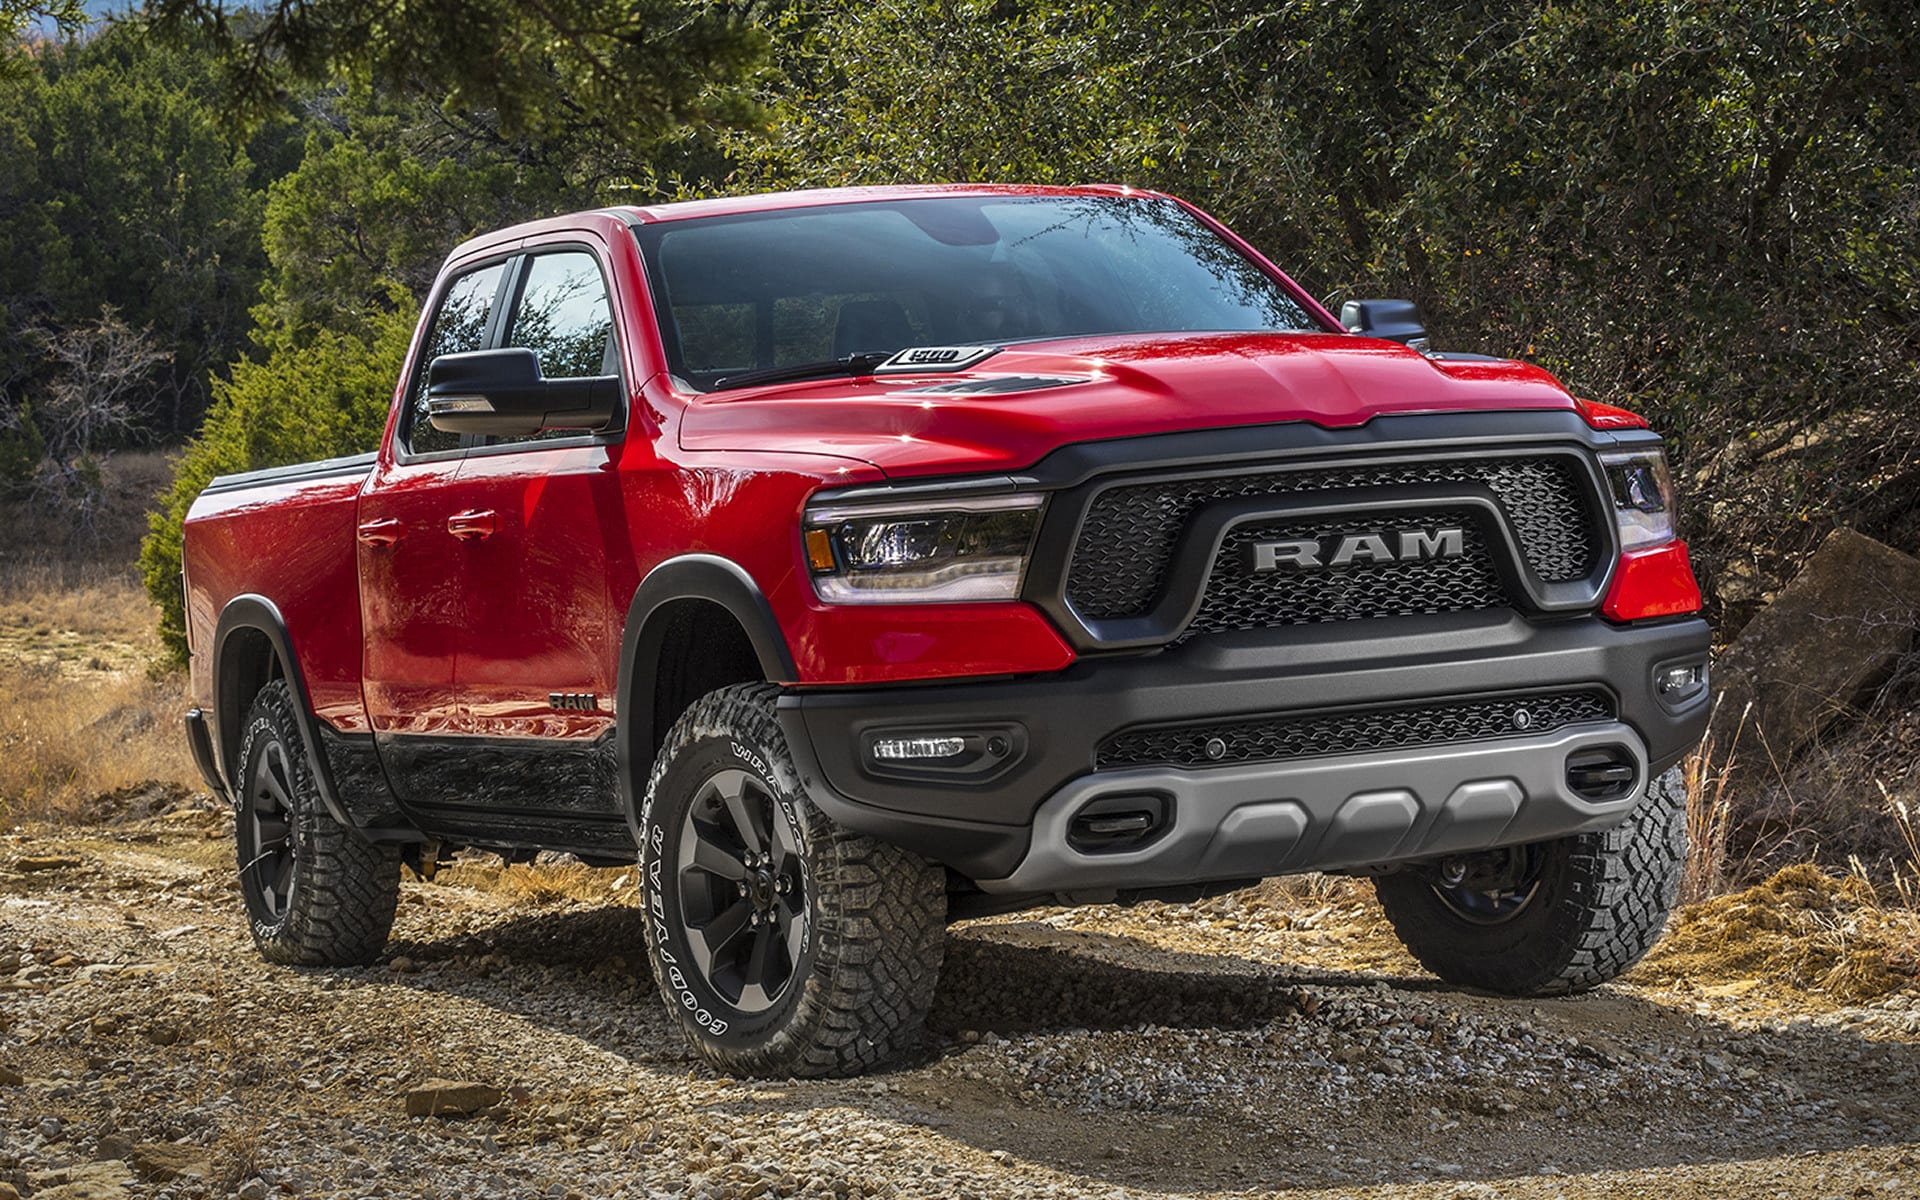
Ram U.S Car Sales Data
This is your hub for all of the Ram sales data for the U.S market.
Ram is an American brand of light to mid-weight commercial vehicles. This new brand was originally a part of the Dodge marquee and marketed using the name of Ram Pickup line of trucks until it was spun off as a separate brand.
The Ram brand was established in order to create a new identity aside from the mainstream Dodge brand. The brand logo features the head of a ram, formerly the logo used by Dodge. Today, the brand focuses on developing and designing pickup trucks for real truck customers rather.
Recognized as one of the brands with the best reputations in the world, trucks sold under RAM have won the ‘Truck of the Year’ award numerous times.
Our Take On Ram US Sales Figures
Ram is one of the best selling brands in the US. They are now ranked as the number two truck brand in the US after seeing its sales surge in 2019 and took over Chevrolet. In total, Ram saw its US pickup truck sales rise to 703,023 units.
Ram’s 2019 pickup truck sales represent an 18-percent increase over the previous year, and they set a new record for the brand since it spun off from FCA’s Dodge in 2009. We can expect Ram to increase its sales even more for the next calendar year as the sales and popularity of all their current lineup increased from 2018.
Ram Monthly Sales Data
Below we have a table that shows Ram sales for the United States automotive market, but this time it is broken out by month. This is on a unit basis. This is Ram new vehicle sales in the US.
Ram Sales & Growth
Below is the unit volume sales and unit growth rate for the Ram brand in the United States.
Ram Annual Sales and Market Share
Below we have a table that shows Ram sales volumes for the US automotive market. This data captures all Ram car sales. We found a great data source in Ram directly who publishes sales data for the U.S market periodically. We were able to aggregate the data into the below format.
| Year | Sales | YOY Change | US Marketshare | Marketshare Change |
|---|---|---|---|---|
| 2005 | 400,543 | 0.00 | 2.37 | 0.00 |
| 2006 | 364,177 | -9.08 | 2.22 | -7.05 |
| 2007 | 358,295 | -1.62 | 2.24 | 0.97 |
| 2008 | 245,840 | -31.39 | 1.87 | -19.39 |
| 2009 | 177,268 | -27.89 | 1.71 | -9.43 |
| 2010 | 199,652 | 12.63 | 1.73 | 1.23 |
| 2011 | 245,454 | 22.94 | 1.93 | 10.28 |
| 2012 | 320,581 | 30.61 | 2.08 | 7.27 |
| 2013 | 367,843 | 14.74 | 2.37 | 12.20 |
| 2014 | 469,139 | 27.54 | 2.86 | 16.87 |
| 2015 | 493,714 | 5.24 | 2.84 | -0.70 |
| 2016 | 542,884 | 9.96 | 3.10 | 8.56 |
| 2017 | 556,790 | 2.56 | 3.23 | 4.10 |
| 2018 | 597,368 | 7.29 | 3.45 | 6.19 |
| 2019 | 703,023 | 17.69 | 4.13 | 16.50 |
| 2020 | 624,637 | -11.15 | 4.25 | 2.83 |
| 2021 | 647,329 | 3.63 | 4.33 | 1.82 |
| 2022 | 138,153 | 0.00 | 2.94 | 0.00 |


